The Real Story of UK Migration: The Official May 2026 Data
In a national conversation often dominated by high-profile media rhetoric and social media speculation, it is essential to ground our discussions in verified data. The Office for National Statistics (ONS) and the independent Migration Advisory Committee (MAC) have released their latest definitive figures.
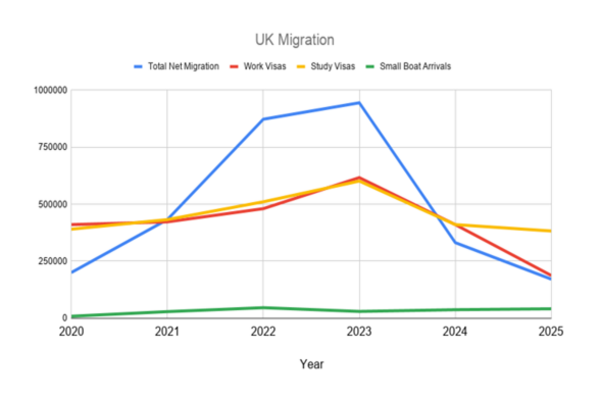
The actual data reveals a landscape that looks vastly different from the daily headlines as shown in the accompanying graph.
1. The Real Scale: Legal Visa Arrivals vs. Small Boats
While irregular "small boat" crossings dominate front-page news, ONS data shows they represent a minor fraction of the total number of people entering the UK.
- Net migration falls to 171,000.
- The Main Drivers: Most of these individuals arrive via legal, tightly regulated visa routes. According to the ONS, 47% arrived for study-related reasons, and 23% arrived for work.
- Small Boat Crossings: Home Office and ONS data shows that 41,000 people were detected arriving via small boats over the same annual period. They can just be seen as the green line.
- The Proportion: For every 1 person who arrives on an irregular boat crossing, roughly 20 people arrive through legal, official channels to work, study, or join family.
2. The Historic Collapse of Net Migration
Despite widespread public perception that immigration is continually rising, official figures show that net migration has experienced one of its sharpest declines in modern British history.
- The 2023 Peak: Net migration previously peaked at an all-time high of 944,000 (ONS revised figure) in the year ending June 2023.
- The Latest Official Figure: The ONS confirms that long-term net migration has plummeted to 171,000 for the year ending December 2025.
- The Trend: Net migration has dropped by nearly 82% from its post-Brexit peak, returning the UK to levels last seen in early 2021. The ONS attributes this dramatic fall primarily to a 47% drop in non-EU nationals arriving for work reasons following tightened visa rules.
3. Our Healthcare System: Who Actually Stays?
The independent Migration Advisory Committee (MAC) published an extensive report analysing who leaves the UK and who stays long-term. Their findings reveal that the health and social care sectors are uniquely held together by international workers who commit to the UK for the long haul.
- The 5-Year Stay Rate: On average, 85% of skilled migrants arriving in recent cohorts stay in the UK long-term. However, retention is highest in public services.
- Health and Social Care Stability: The MAC findings reveal that 88.2% of all migrants working in human health and social work still hold valid immigration status five years after arrival. This is significantly higher than the 76.4% stay rate seen across all other combined industries.
- Nurses and Care Workers: According to the MAC analysis, occupations associated with health and social care—specifically nurses, care workers, and senior care workers—demonstrate the highest long-term stay rates of all common skilled professions. Remarkably, 94% of international nurses still hold valid UK immigration status five years after arriving.
- High Earners Move On: Conversely, the MAC noted that migrants in the highest salary bands (earning over £125,000) demonstrate the lowest stay rates, frequently treating the UK as a temporary career stop before moving on.
The Takeaway: Facts clarify what rhetoric obscures. The official data from the ONS and MAC shows a country whose overall net migration has steeply declined, yet whose National Health Service and care system remain fundamentally anchored by dedicated international professionals who migrate legally, do the work, and stay for the long term.
| Metric |
Historical Peak | Latest Official Figure (2026 Release) | Data Source |
|---|---|---|---|
| Total Net Migration | 944,000 (2023) | 171,000 (Year ending Dec 2025) | ONS |
| Total Legal Immigration | 1.47 Million (2023) | 813,000 (Year ending Dec 2025) | ONS |
| Small Boat Arrivals | 45,774 (2022) | 41,000 (Year ending Dec 2025) | ONS / Home Office |
| 5-Year Health & Care Stay Rate | — | 88.2% still in UK | MAC |
| 5-Year International Nurse Stay Rate | — | 94.0% still in UK | MAC |
References
Migration Advisory Committee (MAC). (2026). Who stays, who leaves? Evidence from Administrative Records on the Skilled Worker Route. UK Government Independent Report.
Office for National Statistics (ONS). (2026). Long-Term International Migration, Provisional: Year Ending December 2025. UK Government Statistical Bulletin.
Office for National Statistics (ONS). (2026). UK Emigration Explained: What We Know About Brits Moving Abroad. Official Population Insights.